
Visualizing data is super fun, but it also takes a lot of planning and organization. One of my favorite organization tools is Trello! Trello is a tool that organizes your work into boards and cards. You can create lists of cards for anything, and those cards can all be full of details and awesome things like checklists, attachments, etc. Since I’ve been blogging lately about Salesforce Chat and Omni Channel, I thought it would be really fun to switch things up and create a Trello template that I could share with the world on how to plan out this dashboard that I’m building. Each list on the board is based on a phase of my typical development process, and the cards give you an idea of what you should actually build. I’ve included some fun tips as well! The development life cycle of all of your Tableau CRM dashboards will basically be the same, so even if you don’t use this to build an Omni-Channel dashboard, hopefully you can use it for something else!

There are a lot of steps to complete before you start building a dashboard. Sure, you can just jump right in, but I’ve found this leads to a lot of change and duplication of tasks. If you spend a little bit more time planning before you start building, you’ll save a lot of time in the end, I promise!
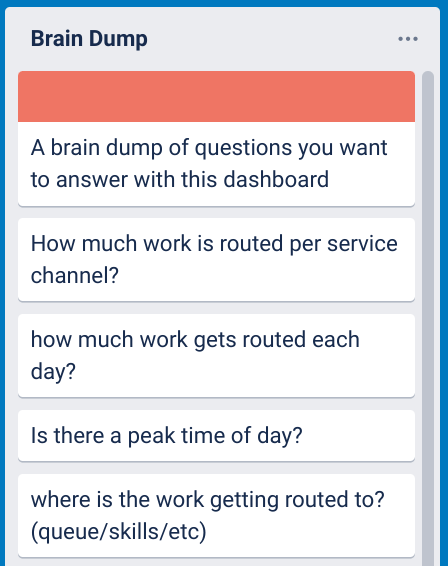
Brain Dump
Most people would probably call this Discovery, but that seems too organized for me. Discovery for me is usually begging people for information and doing a brain dump all over my notebook. But this is where you need to start, with a list of your actual requirements. Like, what are you even building? And why? Who is going to use it? And why? And what are they going to do with it? And why? And if you can get through those questions, then you need to figure out what questions they are trying to answer with this data… and why? 🙂 This will give you a really solid foundation of what your actual requirements are, and how you’ll know when you’re done or not. When you’re done building you should be able to look back on this information and know that you’ve answered all the questions. This also leads to alignment with whoever you’re building the dashboard for – both they and you will know exactly what the final product will be.
Data Prep
Unless you already have existing datasets lying around with this same data, which is totally possible, you’re going to need to create some. And even if you have existing datasets with what you need, you should still evaluate and make sure they have all the fields you will need for the current build, etc. You can’t visualize data without data, so this is an important second step that even comes with its own planning steps. Part of this data prep planning will be asking yourself questions like where is the data coming from? Does it need to be transformed in any way? How often does it need to sync? Do I need to join any other data to it? Will this be used repeatedly or is it a one off query? Will I need to output the results to any other system? Who should have access to the data once its compiled? Lots to think about!

Design
Most of my dashboards follow the same design principles, but I always like to think about it before I start building so I have a cohesive look and feel. I ask myself things like who is going to be using this? Is it more high level or more granular? Do I need to be using certain brand colors or a theme of some sort? (I love using different color schemes for different departments and teams!) Are there any logos or graphics that I need to incorporate? Is the audience cool enough where I can add a gif to the dashboard? (Pretty please?)
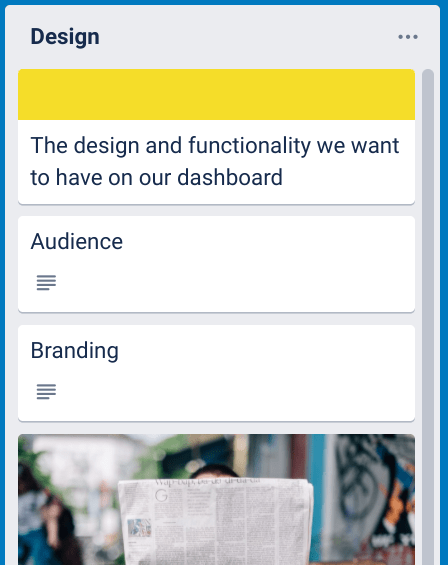
When I think about design, I’m also thinking about how my end users will interact with the dashboard. Do I want them to be able to apply a lot of filters? What will my time context be? Do I need to show a time comparison for context? If so that means bindings and so we’ll want to account for those in other functionality, like if I’m using a binding on a details table then I know I can’t use out of the box sorting and will have to implement an additional component for that. I also think about dashboard flow – how I want them to digest the information. I’ve spoken often about a dashboard reading like a newspaper. You should start with the most important highlights, give some supporting information, and then finally the details. Its also good to think about actionability here. What are they going to do with this data? Should they be able to launch a quick action? Edit data? Mass edit data? Launch a flow? There are a lot of possibilities, and outlining which features you’ll use before you start to build will lead to a better building experience.
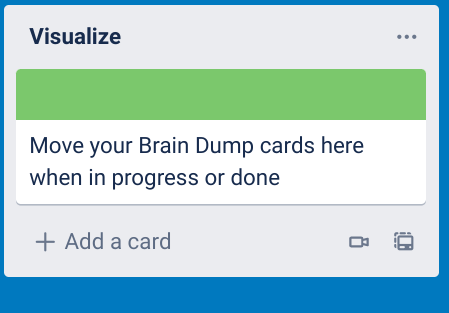
Visualize
Finally! You can start building! Now that we have a plan of action and know exactly what we’re building, and why, you can just do it. This is the fun part… so have fun! As you complete requirements from your Brain Dump column, move them here as your final documentation for those queries/visualizations.
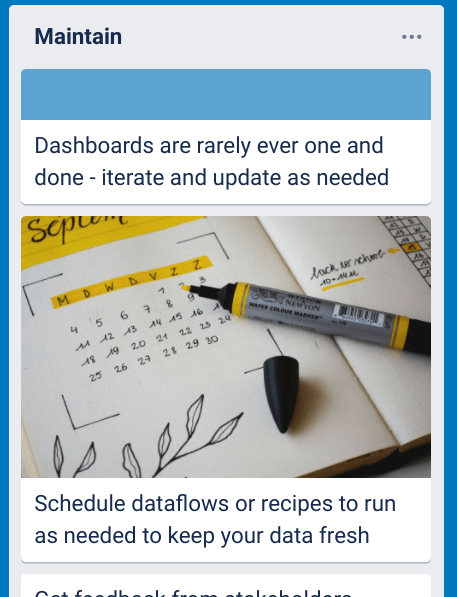
Maintain
Tableau CRM dashboards, or any dashboards really, are very rarely one and done scenarios. With every new fascinating insight you build, more questions will get raised and more things need to be built. Once you think you’re done, you re-evaluate, get new requirements and do it all over again.
Check out the Trello Template
I’m still adding to it, but check out the template and see what you think! I’d love to create more of these, so any feedback you have is super appreciated. Think of it as a blueprint for your own awesome dashboard. Happy planning!

0 comments on “Tableau CRM Dashboard Planning: a Trello Template”