In our last SAQL as a Second Language post, we learned the basic anatomy of a SAQL Query and some syntax. Building on this knowledge, we can now jump into some more advanced statements. In this lesson, we’ll cover group, and review some best practices on when to use it. In later posts we’ll cover cogroup and union.
Personal note: When I was planning this blog post, I had every intention of writing lyrics for “Group it like its hot” and so I’m singing that while I’m writing this. I’m sure that’s stuck in your head now too. I don’t apologize.

Group
The group keyword does just that – it groups the data in a data stream by one or more fields. This is the same as grouping rows in your typical Salesforce report. You’ll use group a lot, especially when you want to create a rollup – aka, calculate the total of your grouped data. Grouping also gives you access to all of the other SAQL Aggregate Functions, allowing you to perform computations across all values of a grouped field. We won’t go into all of these functions, but will cover a few of the most used for now. Some of the ones I use most often are sum(), avg(), and unique(). Just like in your old Salesforce (or any other) reports, you can group by one dimension or many. I’ll be using an Analytics enabled Developer Edition org for these examples so you can easily follow along.
Group by One Field
Sounds easy, right? A great use case for grouping by a single field is visualizing your pipeline. To visualize our pipeline, we want to see the value of opportunities in each stage, and to do that – you guessed it – we’re going to group by 'Stage'. If you’re following along with your own Developer Edition org, there’s something you’ll need to do first.
Navigate to the Trailhead Data Manager app
On the Trailhead Data Manager tab, click “Refresh DTC Data”. This will download the dataflows and sample data that you can use to practice with.
With that our of the way, let’s get started by opening Analytics Studio in our Developer Edition org, and then let’s explore the DTC Opportunity dataset. Using clicks not code, let’s go ahead and set our grouping by adding a bar and selecting ‘Stage’. Now click into SAQL mode and let’s see how it looks.
q = load "DTC_Opportunity_SAMPLE";
q = group q by 'Stage';
q = foreach q generate 'Stage' as 'Stage', count() as 'count';
q = order q by 'Stage' asc;
q = limit q 2000;
In your results, you now have a list of each stage and how many opportunities are in each stage. That was easy enough! We didn’t even have to write anything.
If you don’t need to go into SAQL mode – don’t.
Clicks not code is always the best way to go if you can do everything you need to do. Remember that! I’ve seen many people go down SAQL rabbit holes trying to do something that could have easily been done with clicks instead.
Let’s continue on though! Let’s edit our SAQL so that we can practice our syntax, knowing full well that we don’t need to write this in SAQL. Let’s try out another one of our aggregate functions, sum(). We already have the number of opportunities in each stage but we also want to know the value. What is the total Amount in each stage? Project another measure in your foreach statement:
q = load "DTC_Opportunity_SAMPLE";
q = group q by 'Stage';
q = foreach q generate 'Stage' as 'Stage', count() as 'count', sum('Amount') as 'sum_Amount';
q = order q by 'Stage' asc;
q = limit q 2000;
Now for each Stage, we are getting the total number of opportunities and the sum of Amount. A common request I get is to also see the average value of all the opportunities in each stage. We can add this by using the avg() function.
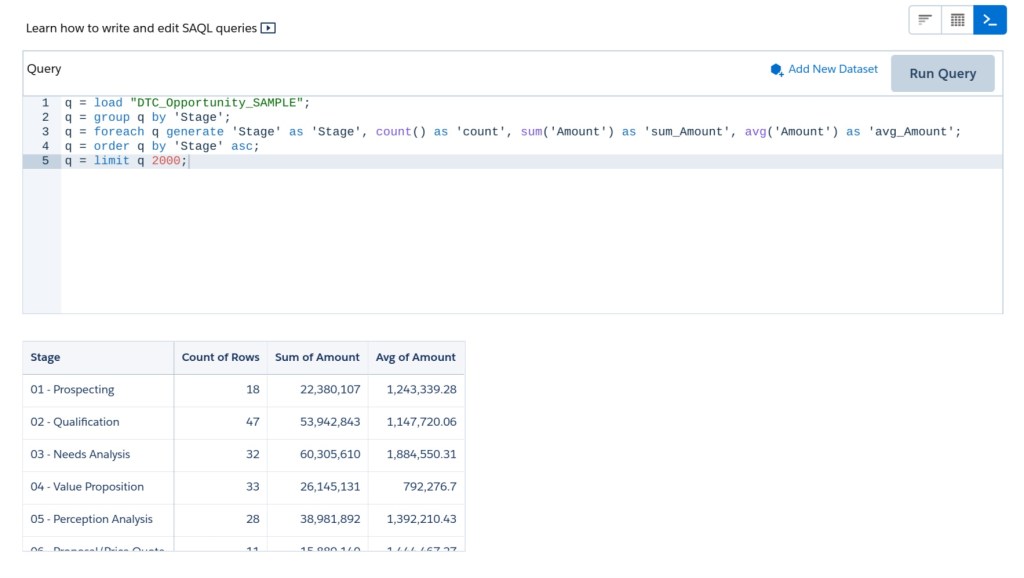
q = load "DTC_Opportunity_SAMPLE";
q = group q by 'Stage';
q = foreach q generate 'Stage' as 'Stage', count() as 'count', sum('Amount') as 'sum_Amount', avg('Amount') as 'avg_Amount';
q = order q by 'Stage' asc;
q = limit q 2000;
These aggregate functions are great because they save us a lot of time. Rather than having to perform math on our own by dividing the total amount by the number of opportunities, the SAQL does it for us since we have a grouping. I should note that you can also group by all. So if we wanted to see the average amount across all of our opportunities, we could group by all and just get one average amount:
q = load "DTC_Opportunity_SAMPLE";
q = group q by all;
q = foreach q generate count() as 'count', sum('Amount') as 'sum_Amount', avg('Amount') as 'avg_Amount';
I think that’s enough of grouping by a single field for now. We’ll build on this more later in the post. You should have something that looks like this:
Group by Multiple Fields
Similarly, you can group by multiple dimensions. The result is as you would expect, just like those old Salesforce reports you have lying around. The syntax is just a little bit different. When we group by multiple dimensions, we wrap our field names in parentheses. Let’s group by another dimension in our example query. We are already projecting several measures for each stage in our pipeline. Let’s also see who owns the opportunities in each stage by adding a group by Opportunity Owner.
q = load "DTC_Opportunity_SAMPLE";
q = group q by ('Stage', 'Opportunity_Owner');
q = foreach q generate 'Stage' as 'Stage', 'Opportunity_Owner' as 'Opportunity_Owner', count() as 'count', sum('Amount') as 'sum_Amount', avg('Amount') as 'avg_Amount';
q = order q by ('Stage', 'Opportunity_Owner' asc);
q = limit q 2000;
Now for each stage we have the Opportunity Owner, count, total value, and average value. Awesome! If you are using clicks not code, the grouping limit in the interface is four. If you’re writing SAQL, you can group by as many things as you want. One thing to consider when grouping by multiple dimensions is that if one of those dimensions is not present on my row of data, it will be excluded. For example: if I add another grouping by Shipping Country, and there is an opportunity without a Shipping Country, that row will no longer be included in my data. We’ll get into handling null values in a later post.
Group it Like Its Hot
Now that we know how to group our data… what kinds of cool stuff can we do with it besides generate normal stuff like this? Another use case that I encounter a lot is aggregating child data. This usually comes in the form of Opportunity Line Items (Opportunity Product) being rolled up to the Opportunity. You might want to only look at Opportunities that have certain Products included. We can filter our Products and then group and use our aggregate functions to still get the Opportunity level detail we want.
I like to always project the OpportunityId in these cases so that we can use the unique() function. The unique function returns the count of unique values. This is helpful for rolling up child items because there might be many child rows to one Opportunity, but we only want to count the Opportunity once.
q = load "products_opportunities";
q = filter q by 'ProductCode' in ["BOO", "CAB", "CAS"];
q = group q by 'Opportunity.StageName';
q = foreach q generate 'Opportunity.StageName' as 'Opport-unity.StageName', unique('OpportunityId') as 'unique_OpportunityId', sum('TotalPrice') as 'sum_TotalPrice';
Grouping our data can lead to all sorts of cool things like windowing functions, cool looking charts, and data manipulation. We’ll talk about more advanced concepts in a later post, but for now – practice makes perfect! Continue to use clicks not code to build queries and then switch to SAQL mode to see the anatomy of your query. Practice grouping by one and many dimensions to get the hang of the syntax, and see what happens to your data if you group by a dimension that isn’t present. See you next time!

0 comments on “SAQL as a Second Language: Group it like its hot”